机器学习教程十二:SVM项目实践
sklearn.svm.SVC
又到了最喜欢的环节,SVM真的难,整理了10个小时还搞不完。官网链接
sklearn.svm.SVC是scikit-learn库中的一个类,用于实现C-Support Vector Classification(C支持向量分类)。它是基于libsvm实现的。SVC用于解决二分类或多分类问题,并且可以处理线性和非线性可分的情况。
参数
参数有很多,我们挑选一些重要的参数说明:
C:正则化参数,默认为1.0。较小的C值表示较强的正则化,对于较大的C值,模型将更多地关注正确分类样本,可能导致过拟合。kernel:核函数类型,用于定义特征空间中的相似度度量。常见的核函数类型有’linear’(线性核函数)、’poly’(多项式核函数)、’rbf’(径向基核函数也叫高斯核)和’sigmoid’(S形核函数)等。还可以使用自定义的核函数(但是我没见过谁自己定义,如果你自己定义一个还比较好用,可以水一篇论文了)。degree:多项式核函数的阶数,默认为3。仅在使用多项式核函数时才适用。gamma:核函数的带宽参数,默认为’scale’,表示使用1 / (n_features * X.var())作为带宽。还可以选择’auto’和浮点数等。shrinking:是否使用启发式缩放,默认为True。启发式缩放可以加快算法的速度,但在某些情况下可能导致精度降低。probability:是否启用概率估计,默认为False。如果启用,则可以使用predict_proba方法获取样本属于各个类别的概率估计。tol:容忍度,默认为0.001。容忍度是停止训练的误差容忍阈值。class_weight:类别权重,默认为None。可以用于处理不平衡类别问题,通过给不同类别设置不同的权重来平衡分类器。max_iter:最大迭代次数,默认为-1,表示无限迭代。decision_function_shape参数用于指定决策函数的形状。在多类别分类问题中,SVM模型可以使用一对一(’ovo’)或一对多(’ovr’)策略来训练模型。decision_function_shape='ovo':返回使用一对一(’ovo’)策略训练的决策函数。决策函数的形状为(n_samples, n_classes * (n_classes - 1) / 2),其中n_samples是样本数,n_classes是类别数。每个决策函数元素表示一个类别对之间的决策值。decision_function_shape='ovr':返回使用一对多(’ovr’)策略训练的决策函数。决策函数的形状为(n_samples, n_classes),其中n_samples是样本数,n_classes是类别数。每个决策函数元素表示样本属于对应类别的置信度值。
方法

-
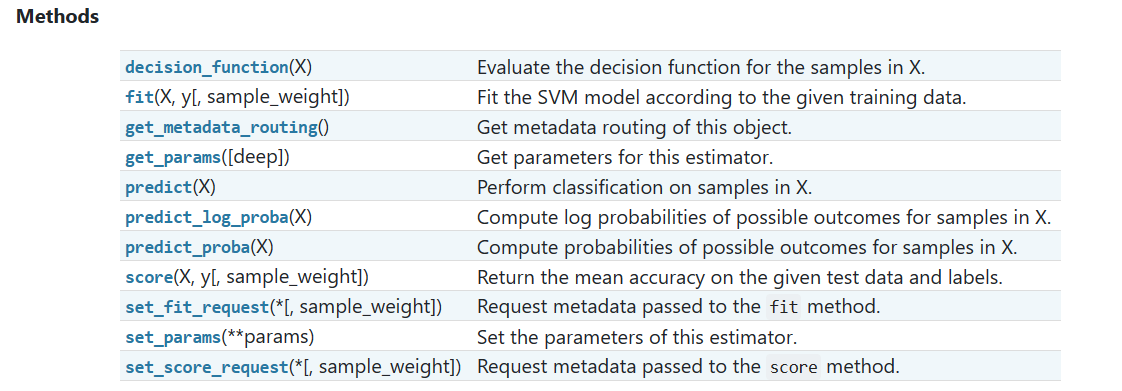
decision_function(X):计算样本X的决策函数值。决策函数值表示样本被分类为正类的置信度。 -
fit(X, y[, sample_weight]):根据给定的训练数据X和标签y来训练SVM模型。可选参数sample_weight用于指定样本的权重。 -
get_metadata_routing():获取该对象的元数据路由。 -
get_params([deep]):获取该估计器的参数。 -
predict(X):对样本X进行分类预测。 -
predict_log_proba(X):计算样本X的各个类别的对数概率。 -
predict_proba(X):计算样本X的各个类别的概率。 -
score(X, y[, sample_weight]):返回给定测试数据和标签的平均准确率。 -
set_fit_request(*[, sample_weight]):请求传递给fit方法的元数据。 -
set_params(**params):设置该估计器的参数。 set_score_request(*[, sample_weight]):请求传递给score方法的元数据。
使用SVM进行鸢尾花分类
加载数据集
使用鸢尾花数据集,鸢尾花数据集有150个样本,每五十个样本为一类,每个样本有4个特征,给出下面的代码进行加载。
from sklearn.datasets import load_iris
from sklearn.model_selection import train_test_split
data=load_iris()
X=data['data']
Y=data['target']
x_train,x_test,y_train,y_test=train_test_split(X,Y,random_state=42,test_size=0.2)
print(x_train.shape,x_test.shape,y_train.shape,y_test.shape)
可以看到数据集的形状:

测试结果
clf=svm.SVC(C=0.8,kernel='rbf',decision_function_shape='ovr')
clf.fit(x_train,y_train)

#计算测试集的准确率
print(clf.score(x_test,y_test))
可以看到能完全分开,准确率为1.0
可视化
为了能让你这种二维生物理解到,我决定把特征减为2个,给你见识见识。给出下面的代码
import numpy as np
from sklearn import svm
import matplotlib.pyplot as plt
import matplotlib as mpl
from sklearn.datasets import load_iris
from sklearn.model_selection import train_test_split

data=load_iris()
X=data['data']
Y=data['target']
X = X[:, :2]
x_train,x_test,y_train,y_test=train_test_split(X,Y,random_state=42,test_size=0.2)
print(x_train.shape,x_test.shape,y_train.shape,y_test.shape)

clf=svm.SVC(C=0.8,kernel='linear',decision_function_shape='ovr')
clf.fit(x_train,y_train)

# 分别打印训练集和测试集的准确率 score(x_train, y_train)表示输出 x_train,y_train在模型上的准确率
def print_accuracy(clf, x_train, y_train, x_test, y_test):
    print('training prediction:%.3f' % (clf.score(x_train, y_train)))
    print('test data prediction:%.3f' % (clf.score(x_test, y_test)))
    # 计算决策函数的值 表示x到各个分割平面的距离
    print('decision_function:n', clf.decision_function(x_train)[:2])

def draw(clf, x):
    iris_feature = 'sepal length', 'sepal width', 'petal length', 'petal width'
    # 开始画图
    x1_min, x1_max = x[:, 0].min(), x[:, 0].max()
    x2_min, x2_max = x[:, 1].min(), x[:, 1].max()
    # 生成网格采样点
    x1, x2 = np.mgrid[x1_min:x1_max:200j, x2_min:x2_max:200j]

    grid_test = np.stack((x1.flat, x2.flat), axis=1)
    print('grid_test:n', grid_test[:2])
    # 输出样本到决策面的距离
    z = clf.decision_function(grid_test)
    print('the distance to decision plane:n', z[:2])
    grid_hat = clf.predict(grid_test)
    # 预测分类值 得到[0, 0, ..., 2, 2]
    print('grid_hat:n', grid_hat[:2])
    # 使得grid_hat 和 x1 形状一致
    grid_hat = grid_hat.reshape(x1.shape)
    cm_light = mpl.colors.ListedColormap(['#A0FFA0', '#FFA0A0', '#A0A0FF'])
    cm_dark = mpl.colors.ListedColormap(['g', 'b', 'r'])
    plt.pcolormesh(x1, x2, grid_hat, cmap=cm_light)  # 能够直观表现出分类边界

    plt.scatter(x[:, 0], x[:, 1], c=np.squeeze(Y), edgecolor='k', s=50, cmap=cm_dark)
    plt.scatter(x_test[:, 0], x_test[:, 1], s=120, facecolor='none', zorder=10)
    plt.xlabel(iris_feature[0], fontsize=20)
    plt.ylabel(iris_feature[1], fontsize=20)
    plt.xlim(x1_min, x1_max)
    plt.ylim(x2_min, x2_max)
    plt.title('Iris data classification via SVM', fontsize=30)
    plt.grid()
    plt.show()

print('-------- eval ----------')
print_accuracy(clf, x_train, y_train, x_test, y_test)
print('-------- show ----------')
draw(clf, X)
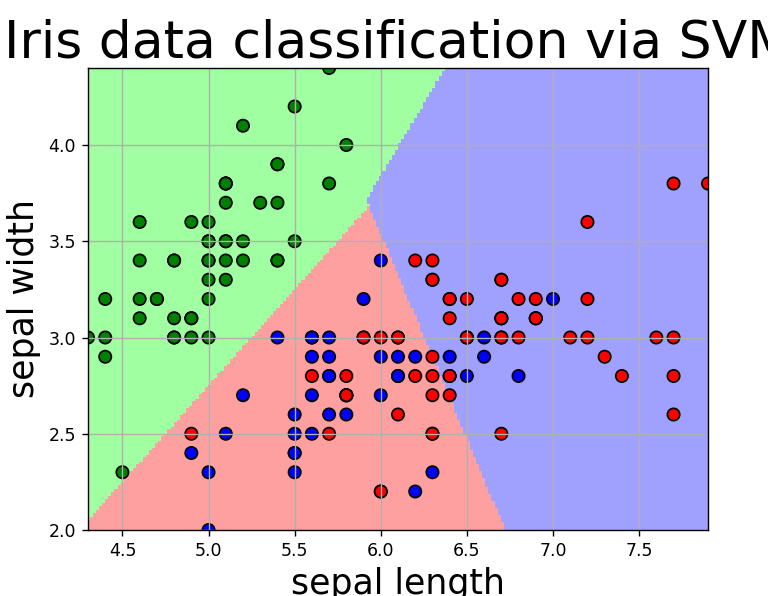
得到下面的结果

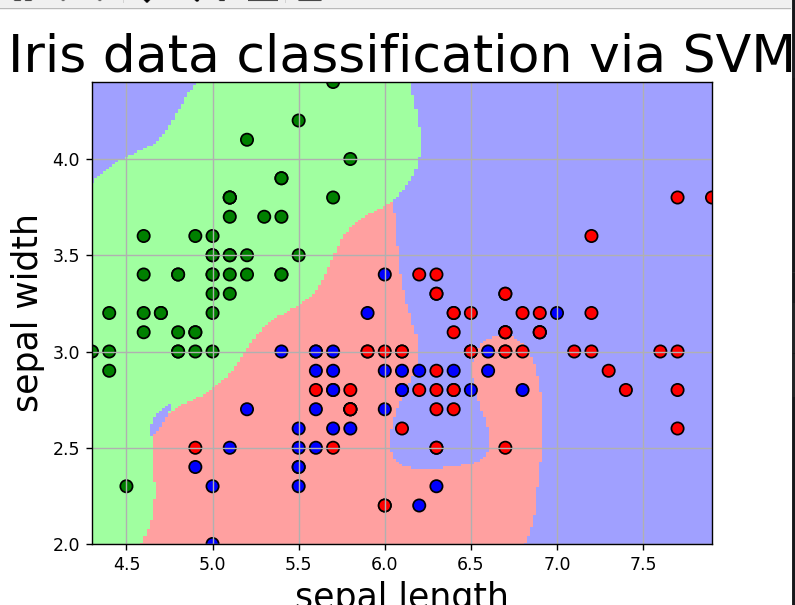
这个核函数选择的是线性核函数,准确率为90%,特征少了,分类准确率降低。我们使用高斯核函数,设置gamma=10,得到下面结果,准确率为86%,没有得到提升。

使用SVM进行mnist数字识别
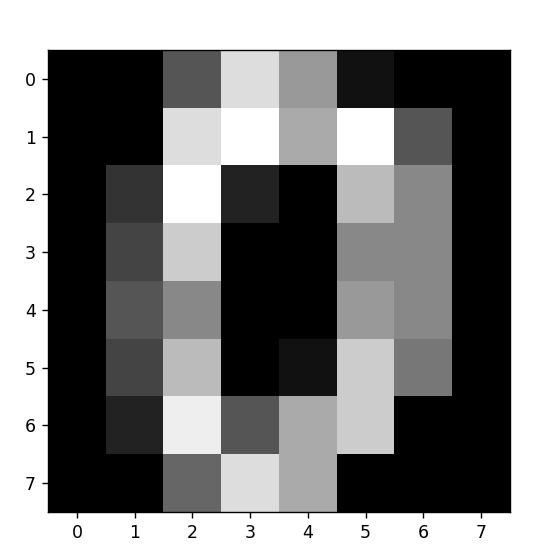
mnist数据集有1797张灰度图片,每张图片有64个像素点,我们可以使用matplotlib进行查看一下:
# 加载MNIST数据集
digits = datasets.load_digits()
X = digits.data
print(X.shape)
y = digits.target
print(y.shape)

plt.imshow(X[0].reshape(8, 8),cmap='gray')
plt.show()
得到下面的图片:

“0”
数据集预处理
from sklearn import datasets
from sklearn.model_selection import train_test_split
from sklearn.svm import SVC
from sklearn.metrics import accuracy_score

# 加载MNIST数据集
digits = datasets.load_digits()
X = digits.data
print(X.shape)
y = digits.target
print(y.shape)

# 将数据集拆分为训练集和测试集
X_train, X_test, y_train, y_test = train_test_split(X, y, test_size=0.2, random_state=42)
创建模型进行预测
# 创建SVM模型
svm_model = SVC(kernel='rbf')

# 在训练集上拟合SVM模型
svm_model.fit(X_train, y_train)

# 在测试集上进行预测
y_pred = svm_model.predict(X_test)

# 计算准确率
accuracy = accuracy_score(y_test, y_pred)
print("准确率:", accuracy)


